
Competitor Analysis
The Competitor Analysis tool allows you to see at a glance how you compare to the competition and understand in which areas you are ahead of your competition and which areas need improvement.
If you have booked the Competitor Analysis feature at re:spondelligent, it becomes available in the app, thus, you can add the competitors of your choice. You can find it in the app by choosing Competition under Benchmarking on the left-side menu.
Add competitors
Search for your competitor in the Google Maps window. When you start typing in the search bar, a drop-down list will open. Click on the competitor you would like to have in your set, and it will be added to the list on the right side.
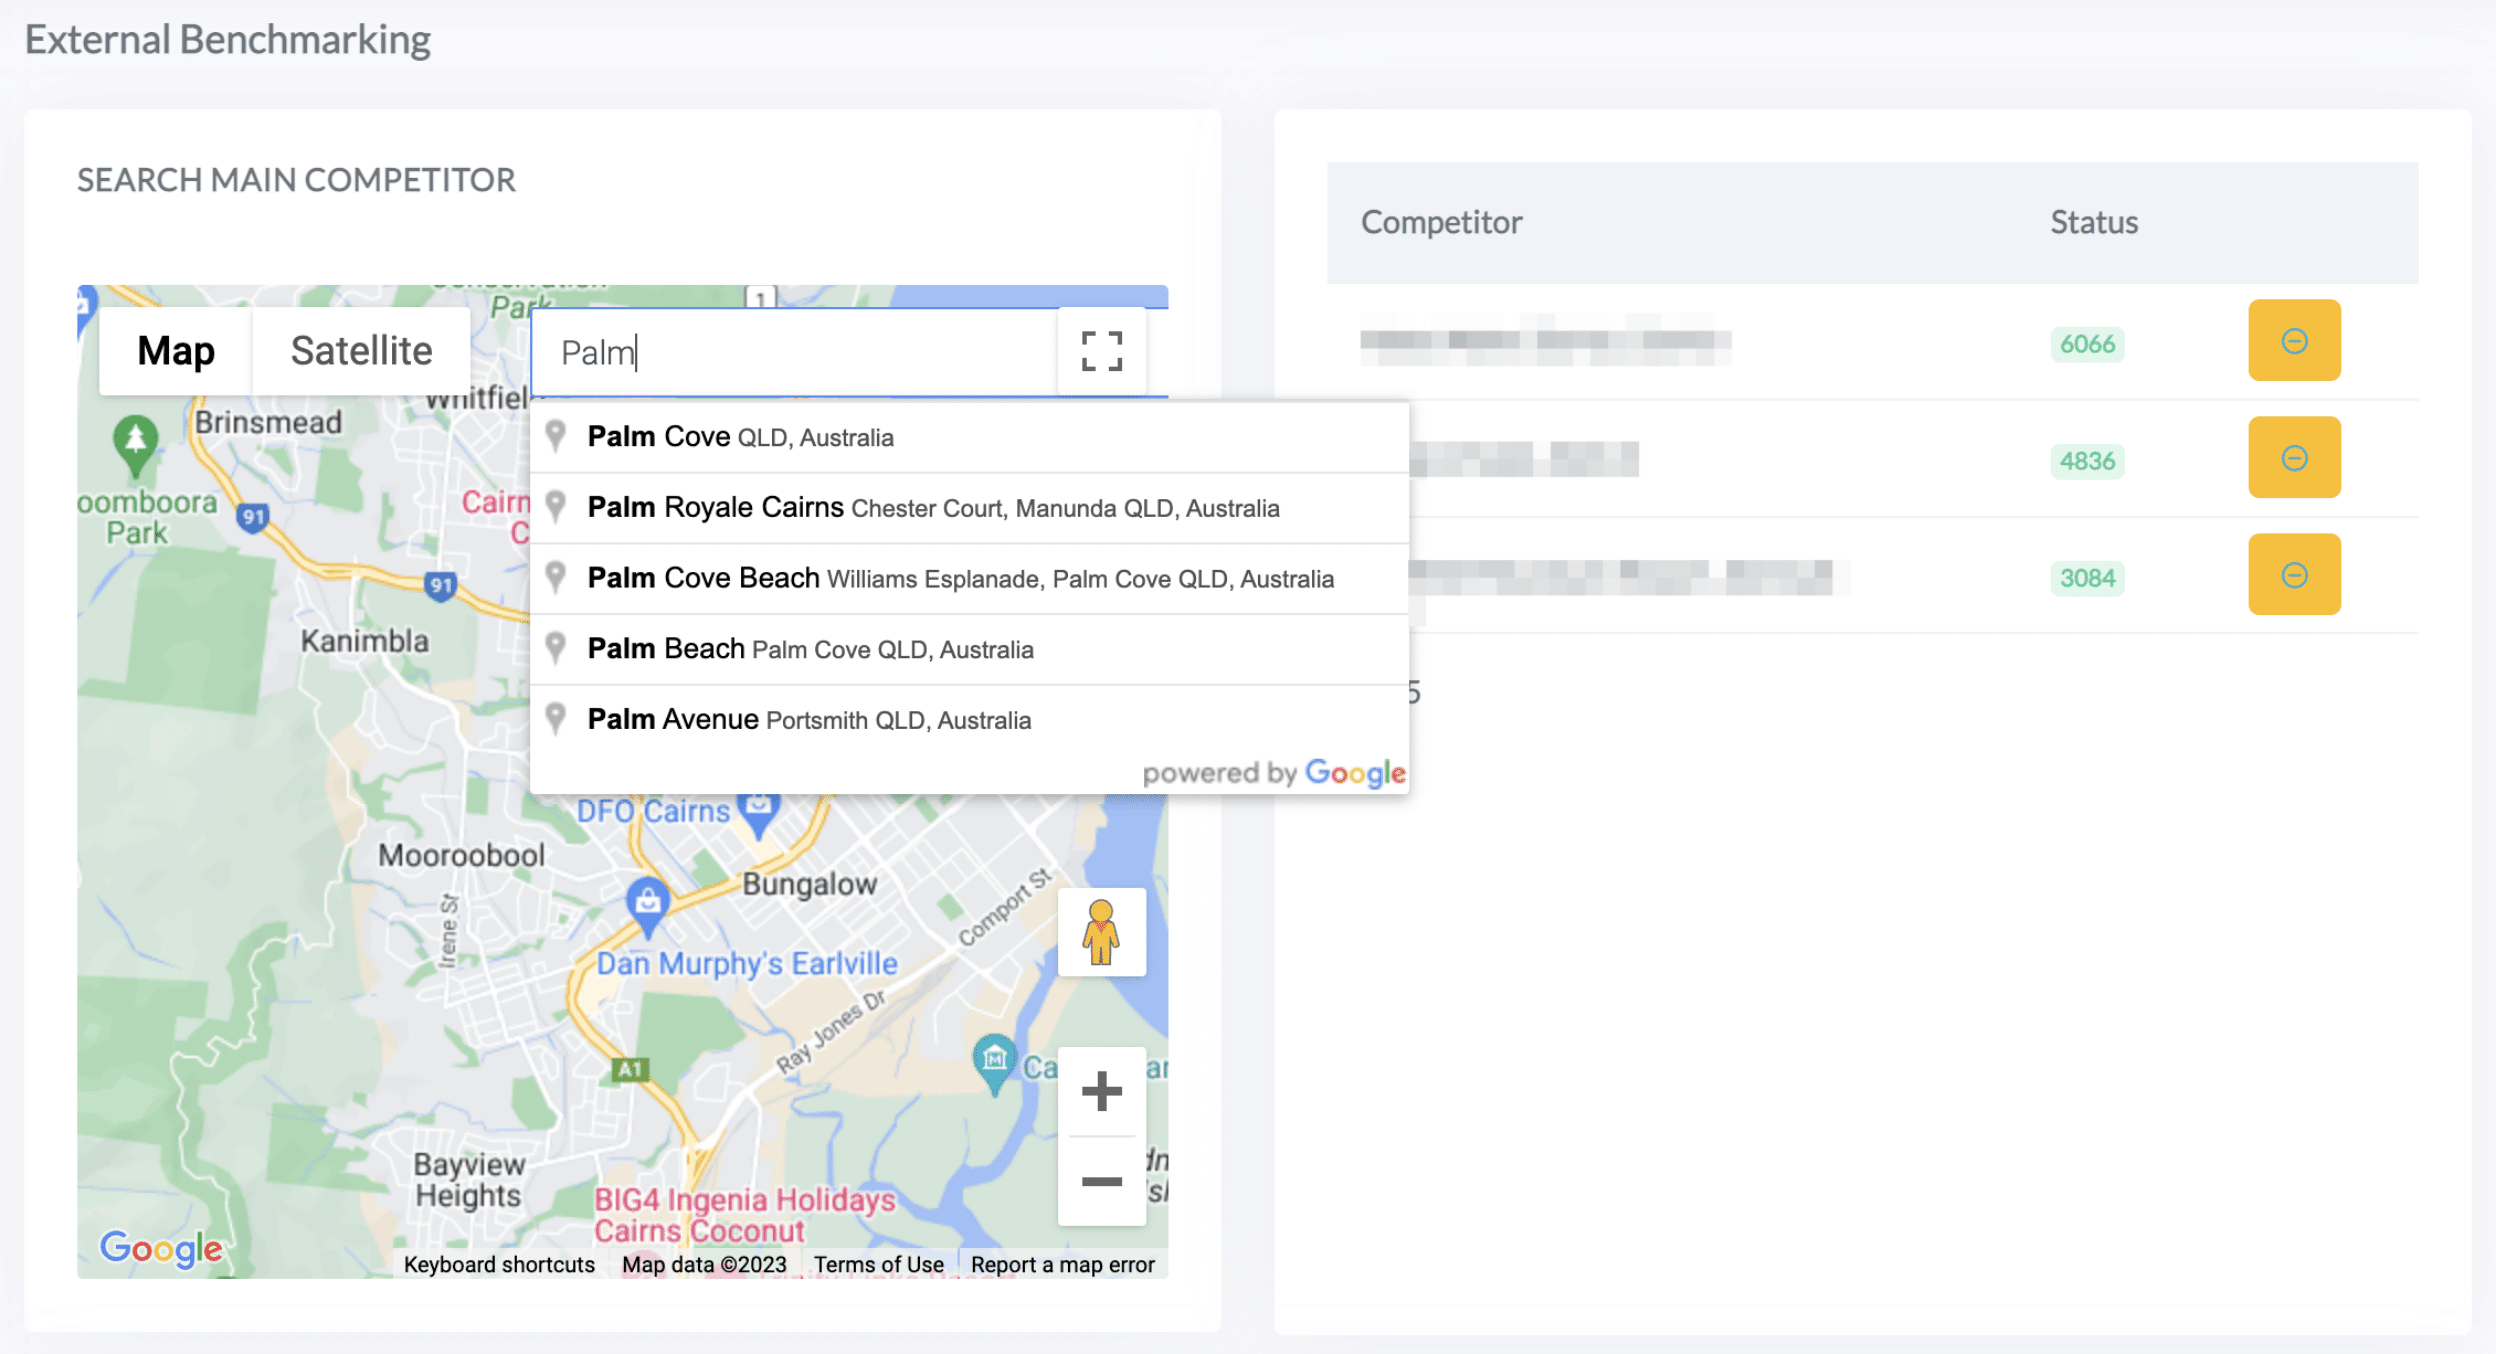
The data will start loading and will become available within 24-48 hours. It is possible to add up to 5 competitors.
Overview
In the Overview, you can see a list of the competitors you have added as well as your location. It allows you to compare your own business with your competitors and keep track of your competitors’ performance.
The KPIs include:
- re:Score
- Number of reviews
- Ave. rating
- Distribution of negative, positive, and neutral sentiments
- Response rate
- Response time
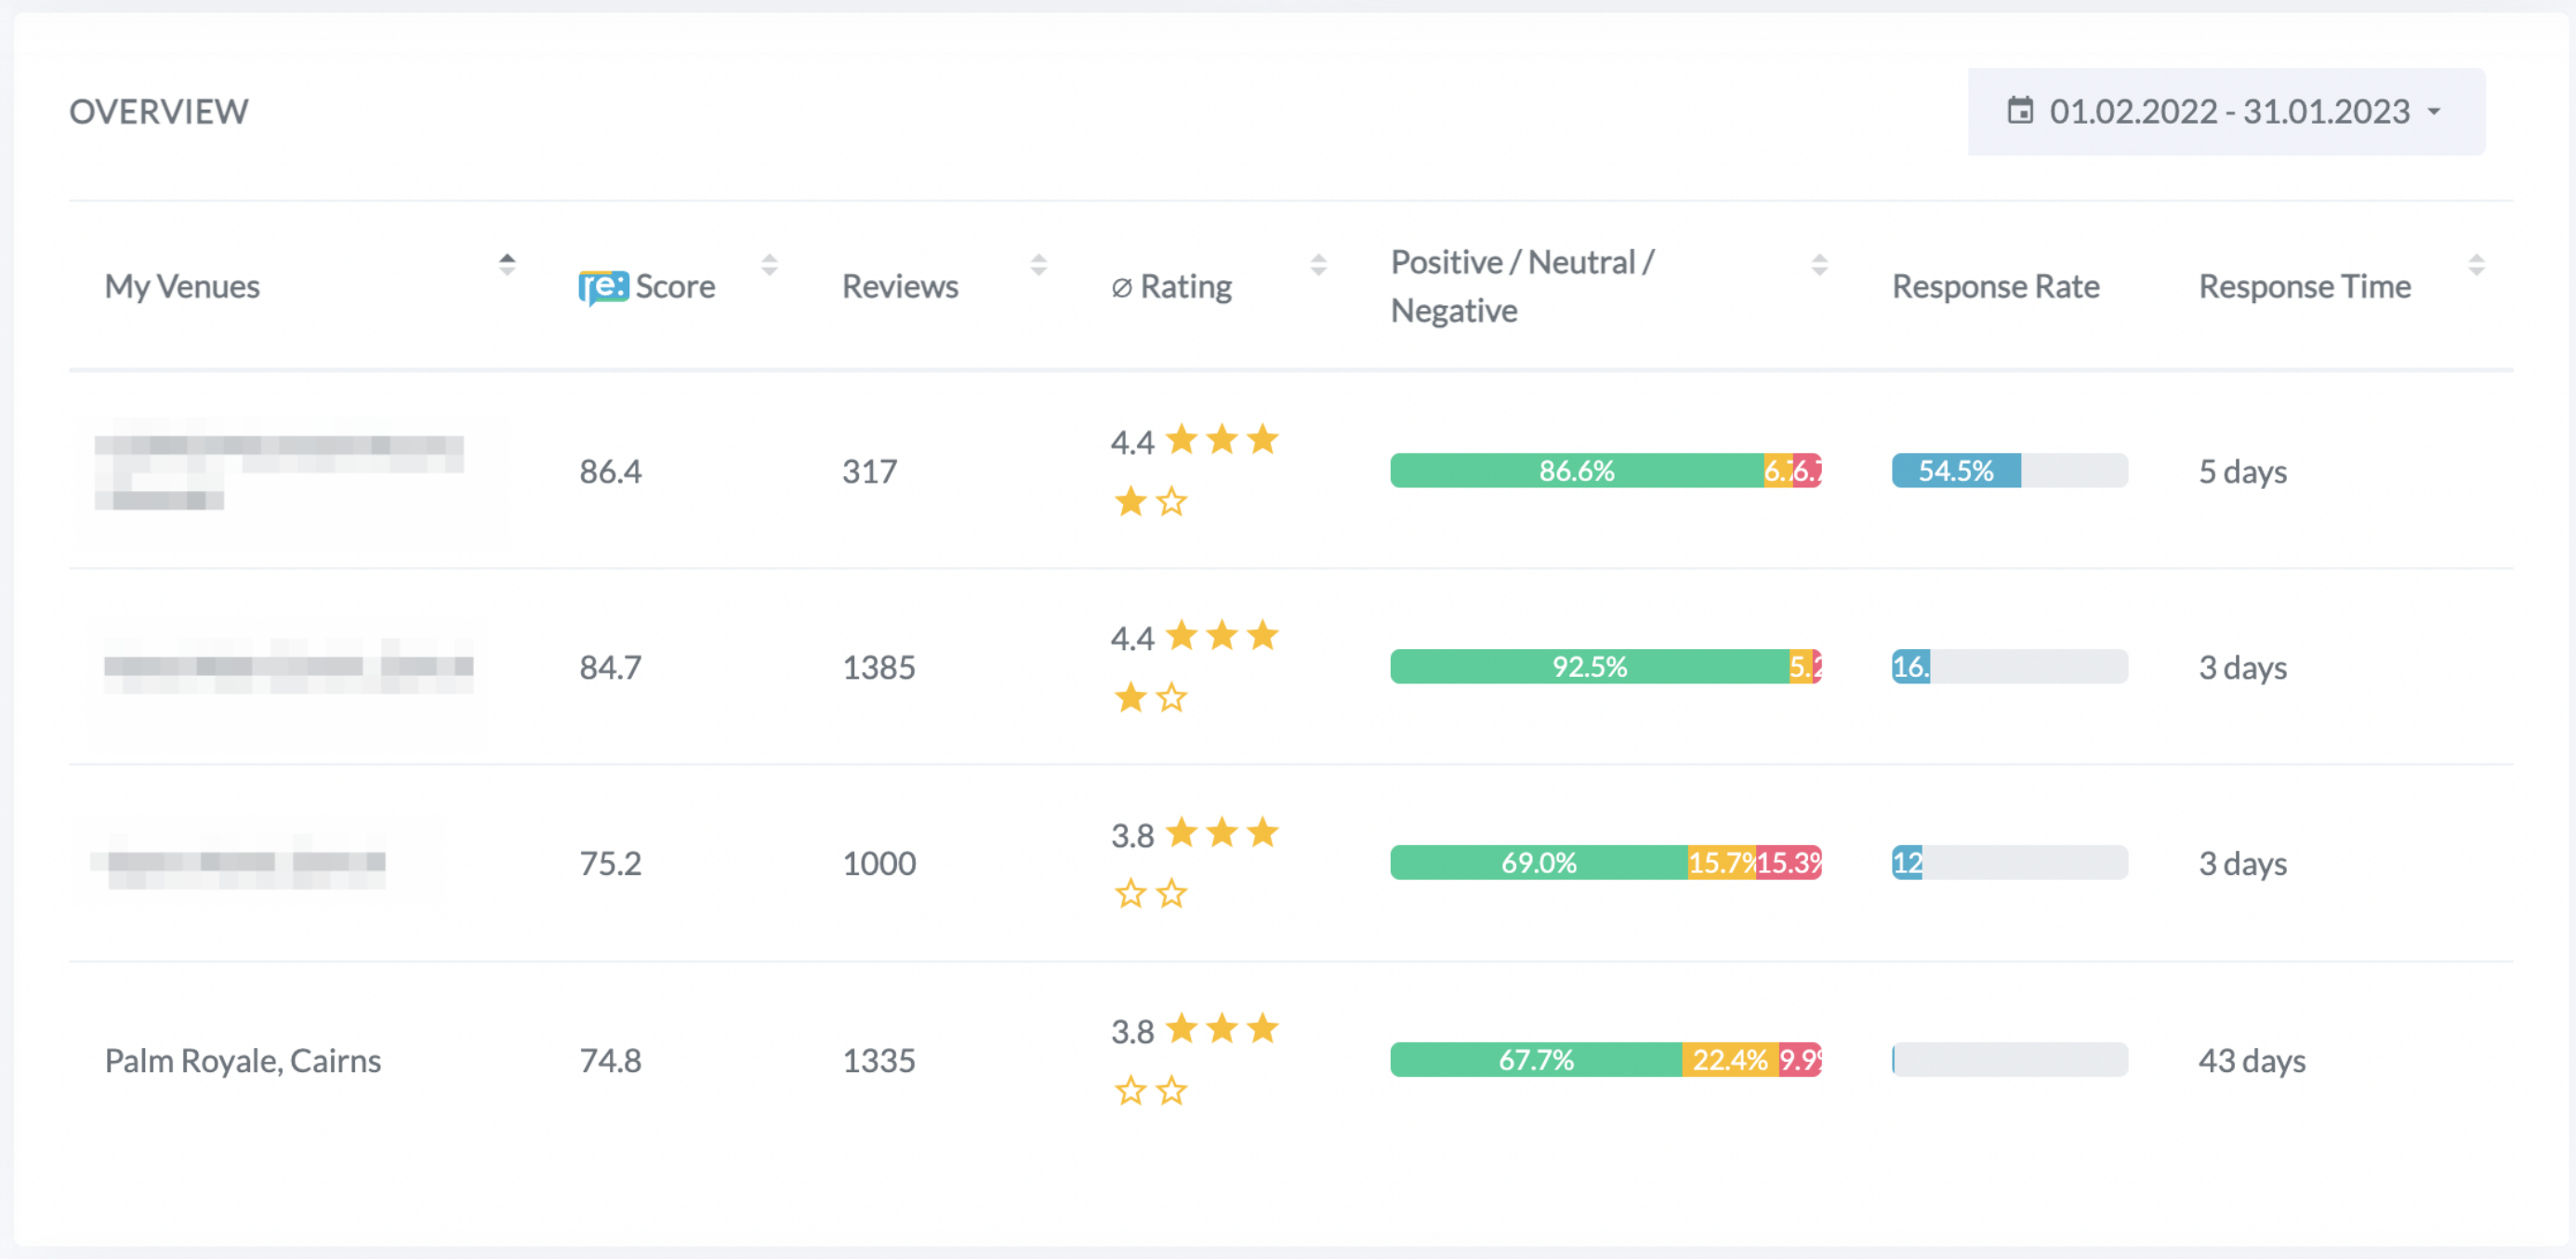
You can organize the list according to your needs. Click on the column headline to sort in ascending or descending order. For example, you can see the locations with the highest re:Score by clicking twice on the re:Score.
Use the date picker at the top of the widget to change the timeframe.
re:Score Trend
re:Score development can be monitored in the Trend widget. Hover over the graph to see the exact scores for each month.
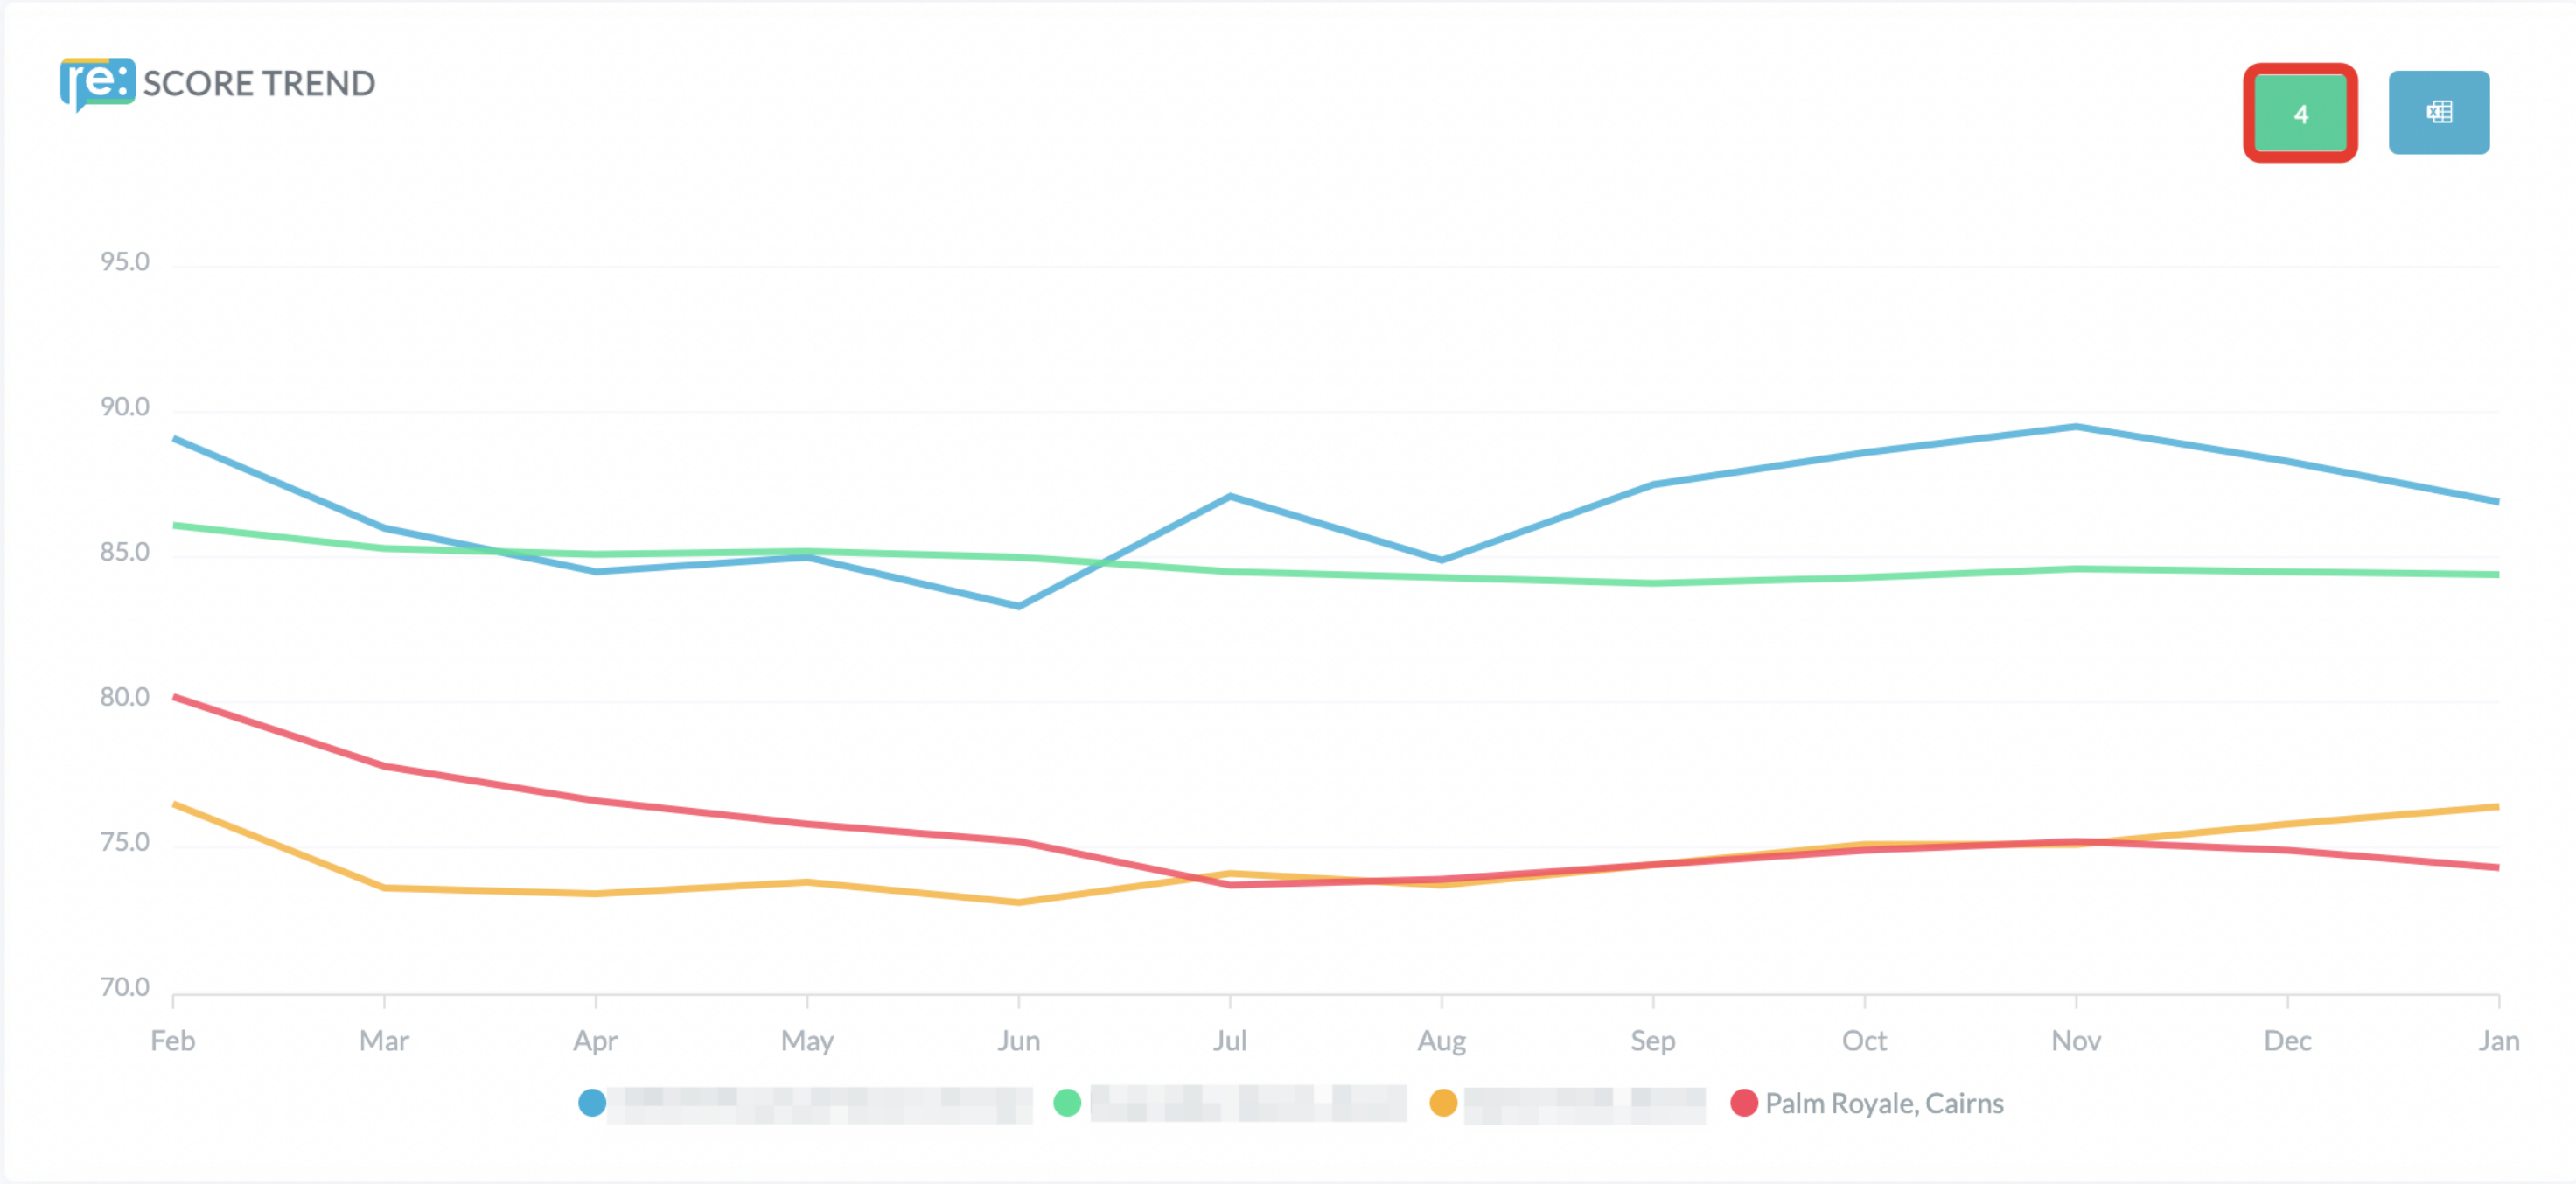
By clicking on the green button you can choose which competitors you would like to see in the Trend widget. You can highlight one location by hovering over its name below the chart. If you click on it, the location will be removed from the chart.
To export the data into an excel file, click on the blue button.
Categories
The Categories widget gives a quick overview of the content analysis of online reviews. The spider chart shows the development of average ratings in each category. So at a glance, you can see in which area you are doing better than your competitors.
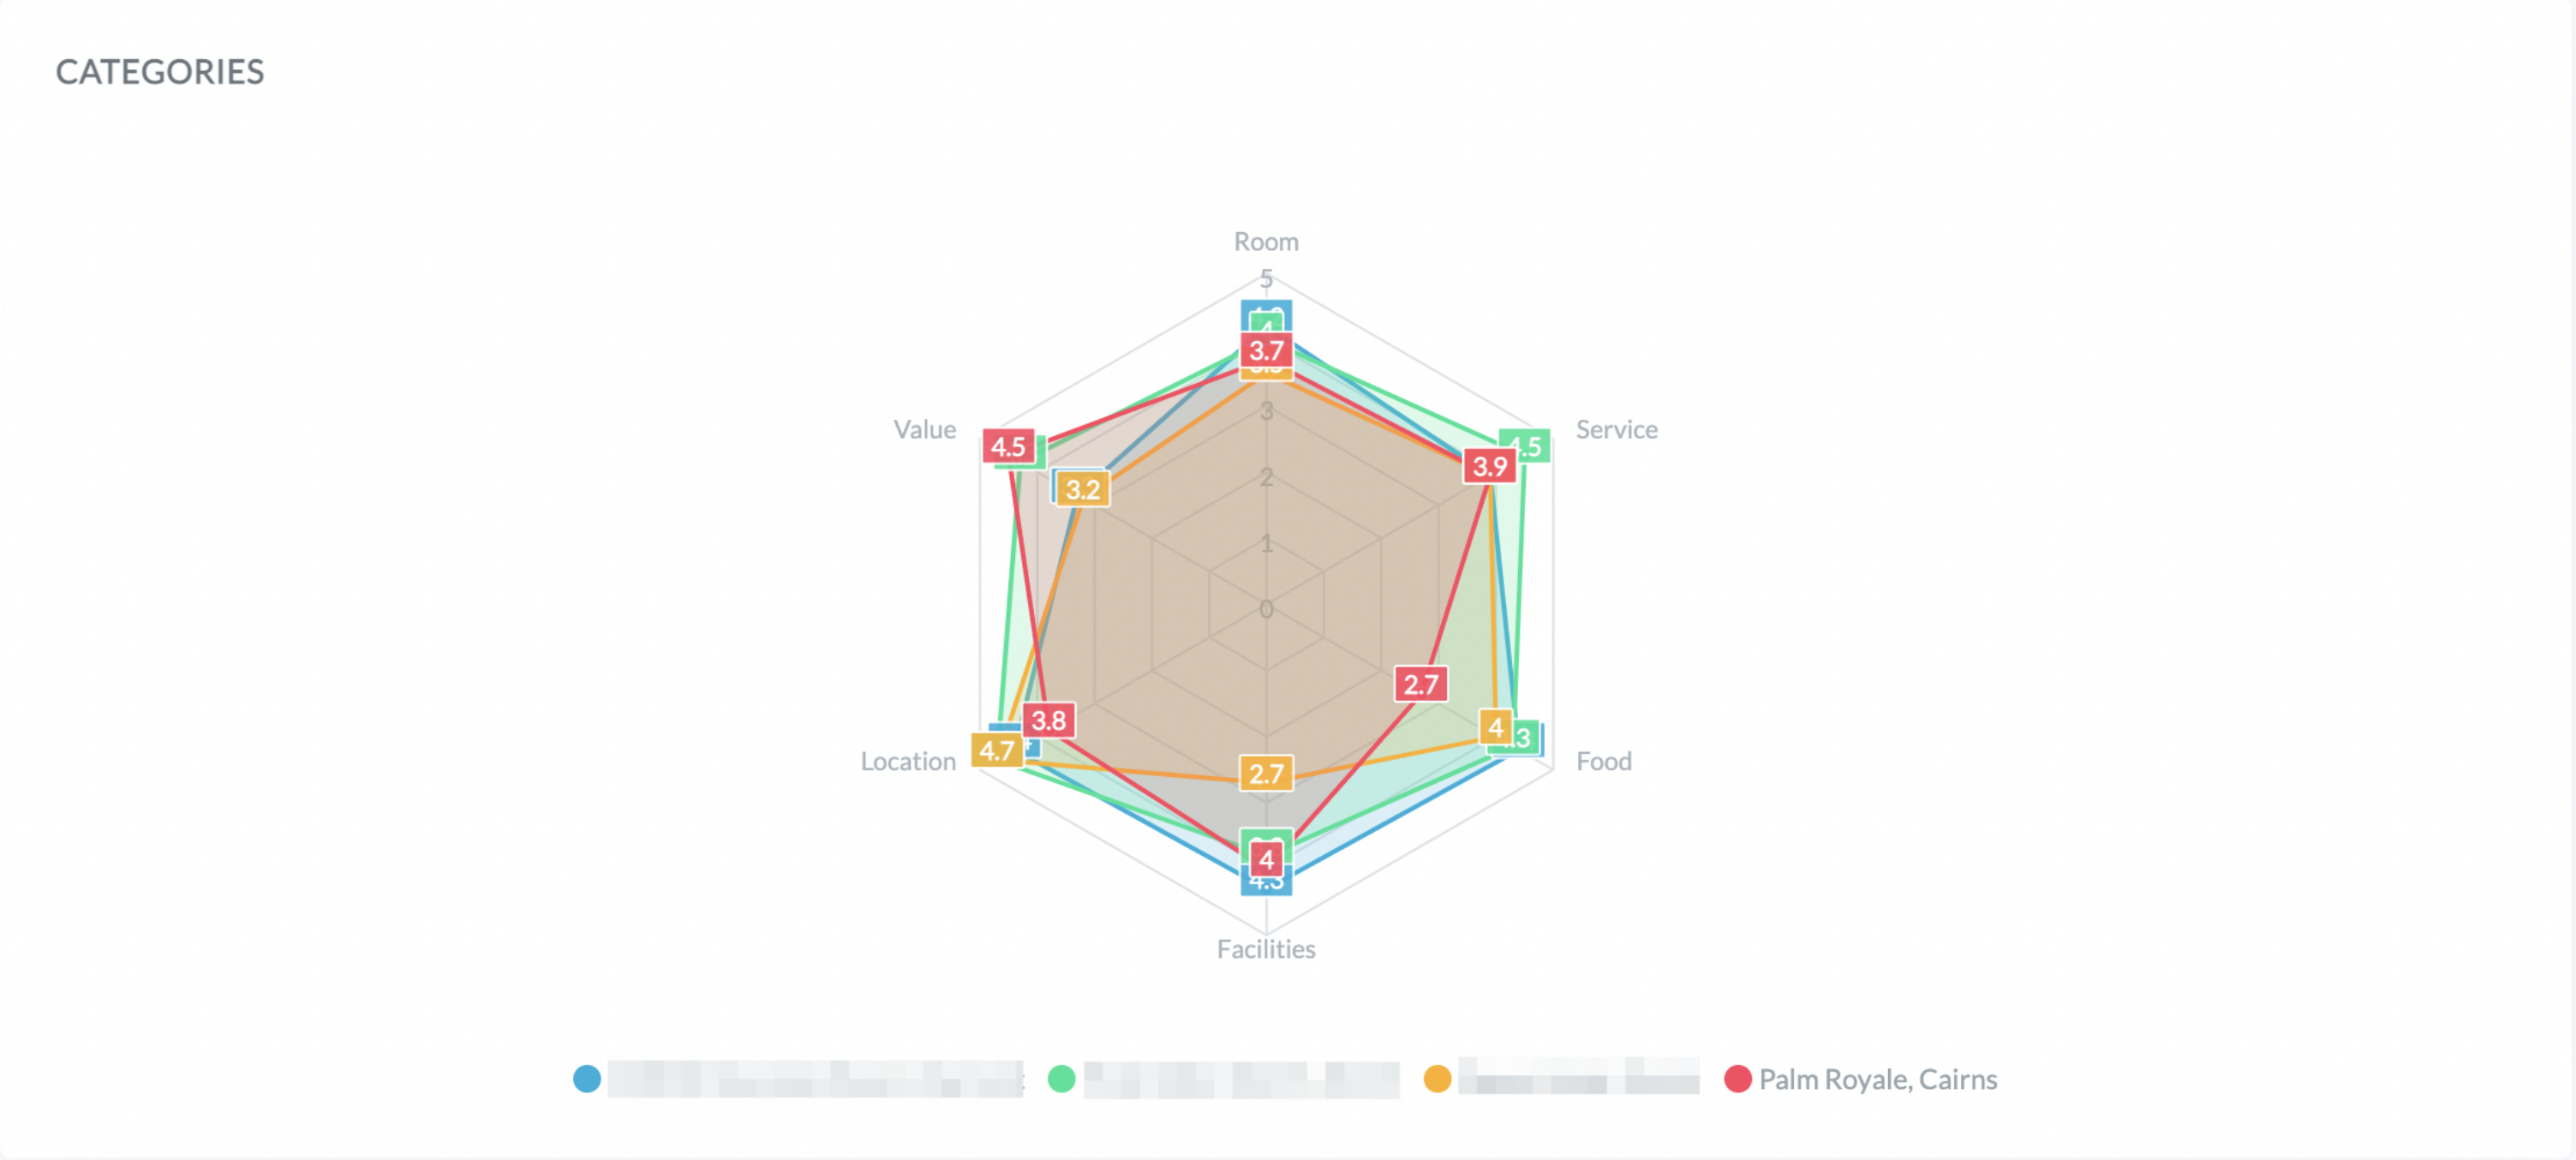
First, select the competitors you would like to compare to in the Trend widget. As in the Trend widget, you can highlight one location by hovering over its name below the chart or remove it by clicking on it.
You can have a detailed one-to-one comparison in the Comparison dashboard.