Reviews
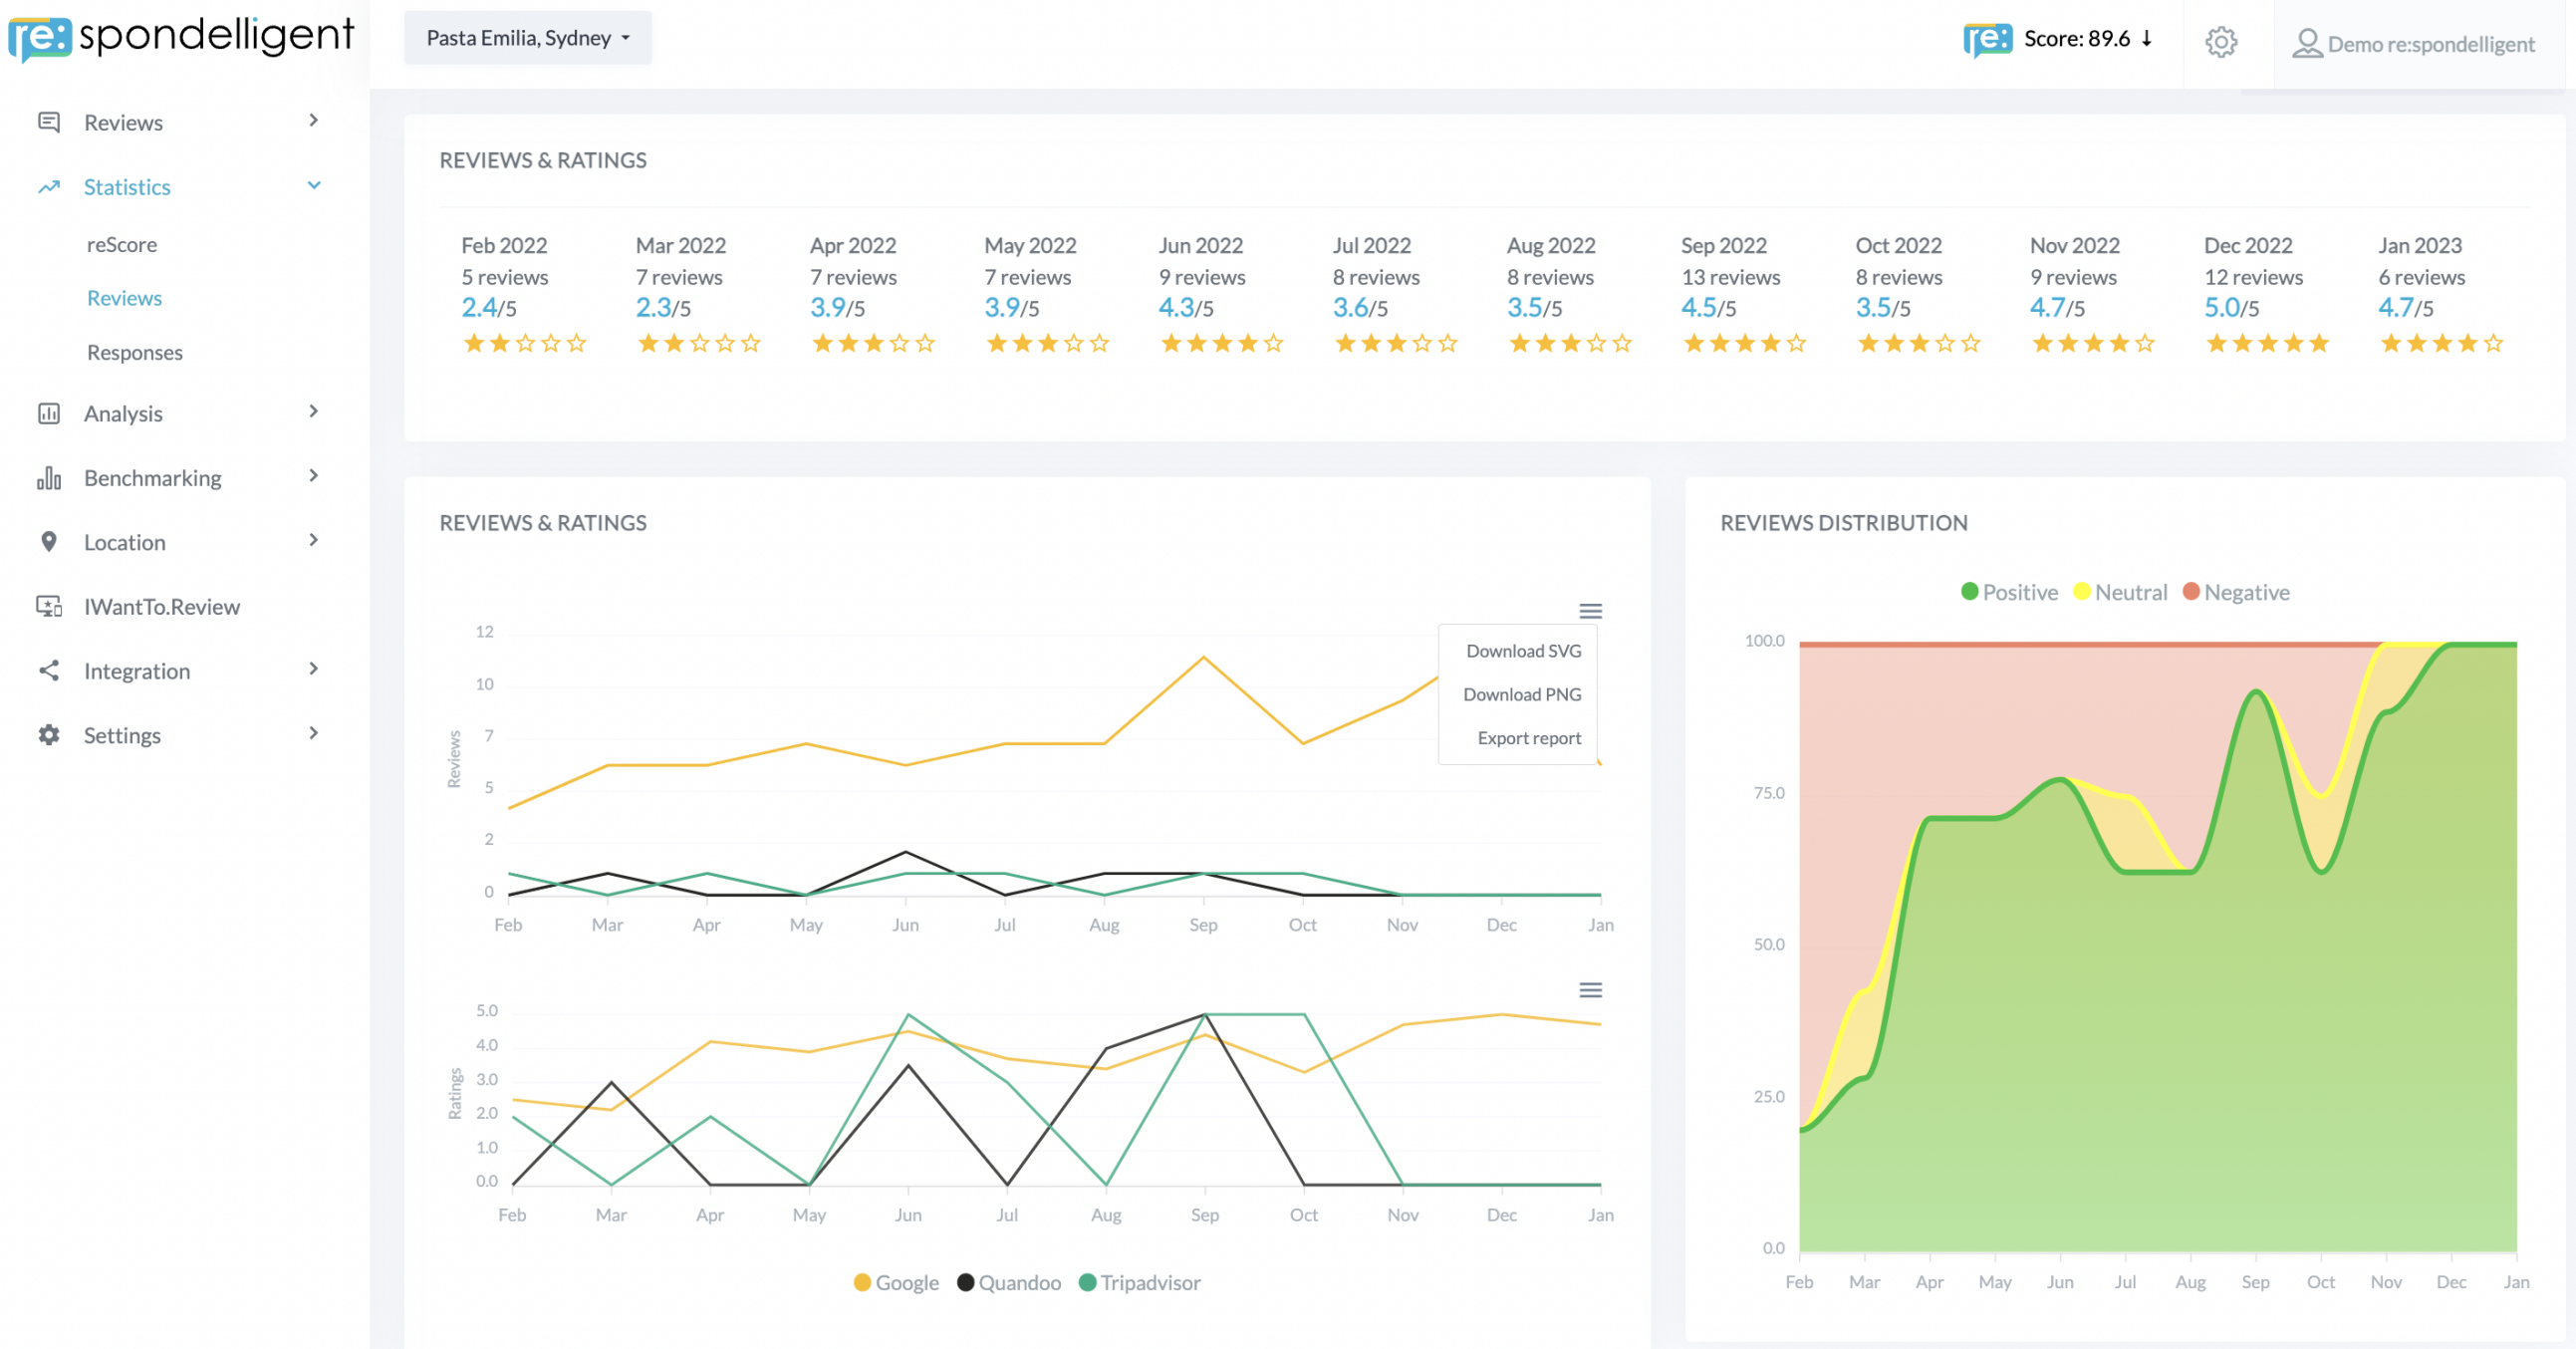
Choose Reviews under Statistics on the left-side menu. This dashboard shows a detailed graphic overview of your online reviews.
1. Reviews & Ratings
Here you can see your reviews and ratings per month in a given period. By default, the data is shown for the last 12 months. The date picker at the top of the page allows you to define the time period shown in reports.
The graph on the left shows the development of the number of reviews and the average star rating per platform per month. Click on the platform name to add or remove the platform from the graph. The graph on the right shows the review statistics for positive, neutral, and negative ratings. If you mouse over it, you will see detailed statistics per month.
Click on the hamburger button next to the Reviews & Ratings widget to download it as an SVG or PNG file or export the report in excel.
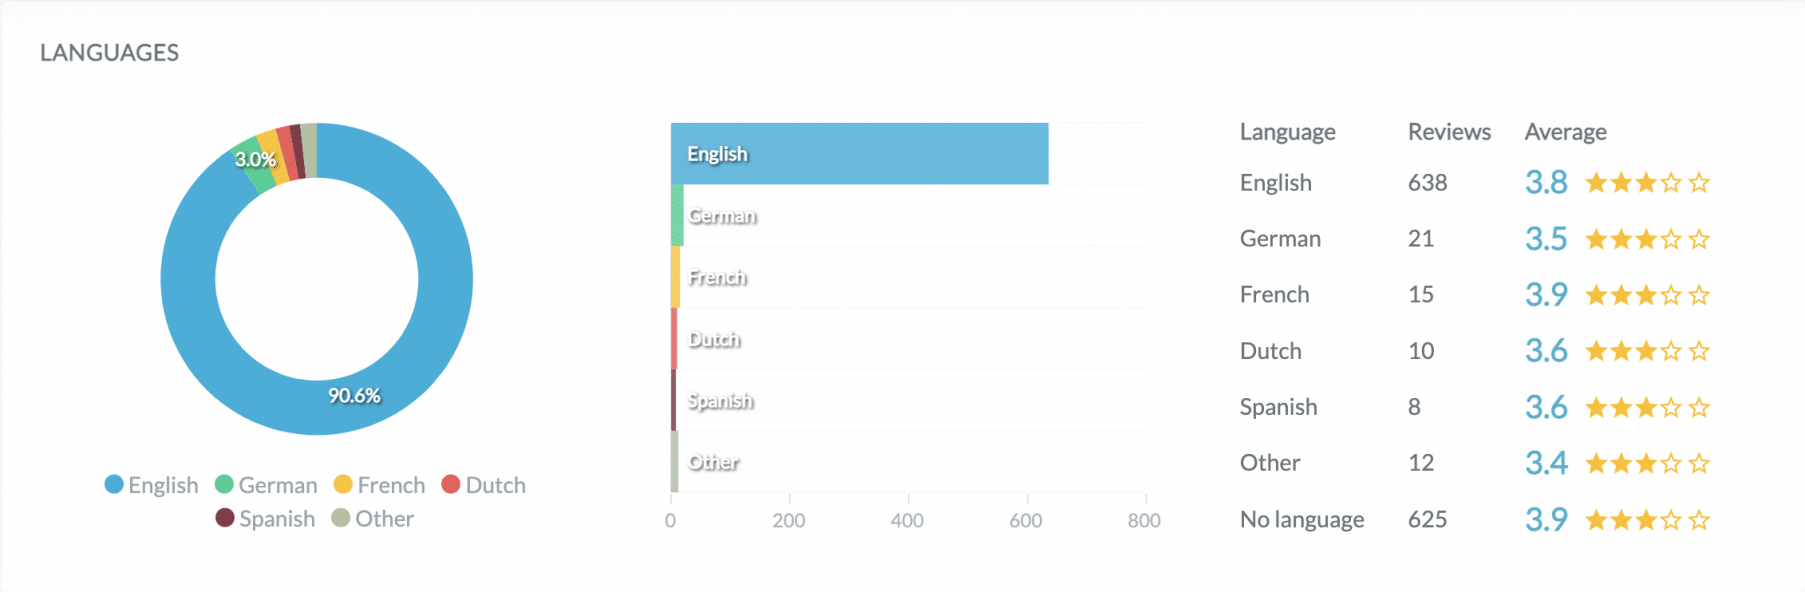
2. Language
Find out in which language your guests are writing reviews for your business. Here you have a quick overview of the number of reviews written in each language. Besides, you can see the average rating per language. “No Language” means the review was left without a text.
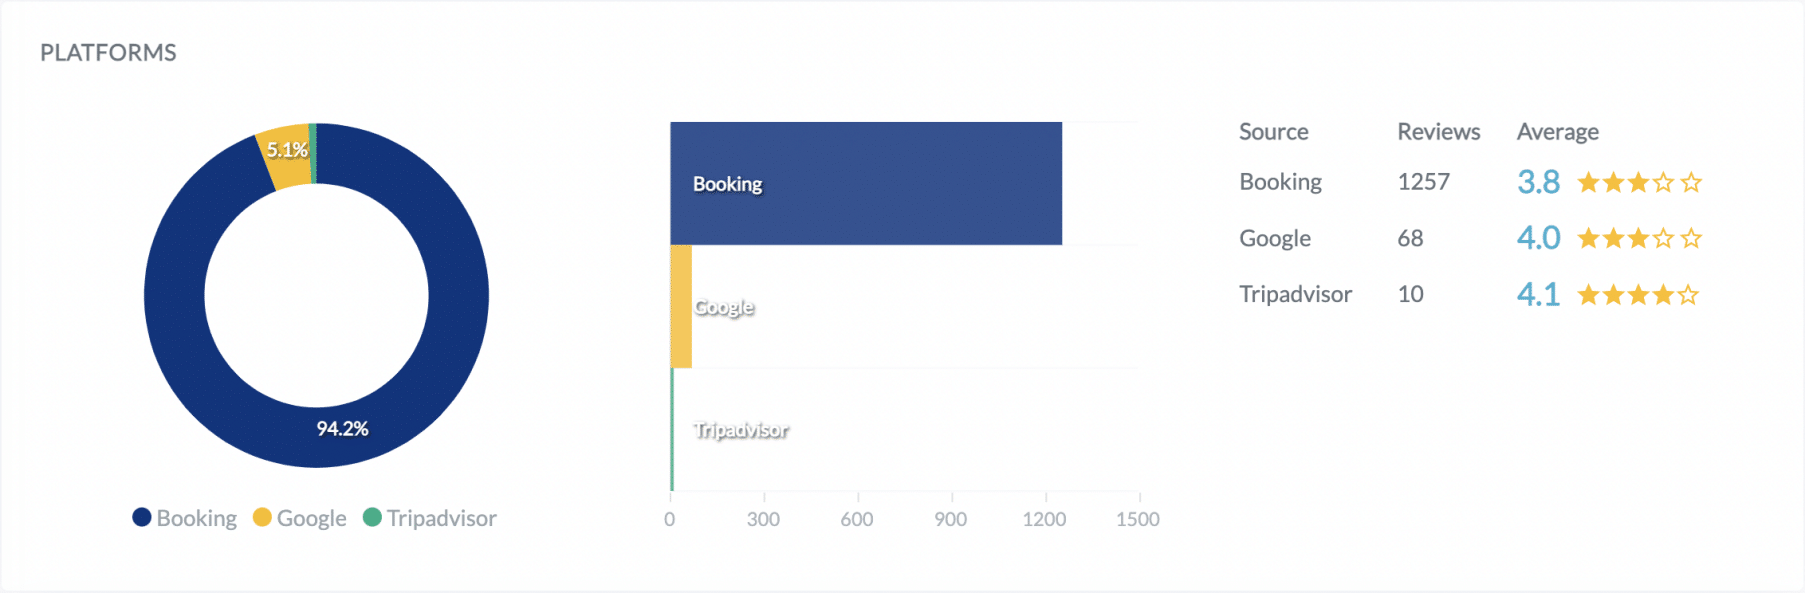
3. Platforms
On which platforms do you get the most reviews? The users on which platforms review more negatively or positively than on the others? The Platforms widget shows the platform distribution of all your reviews.
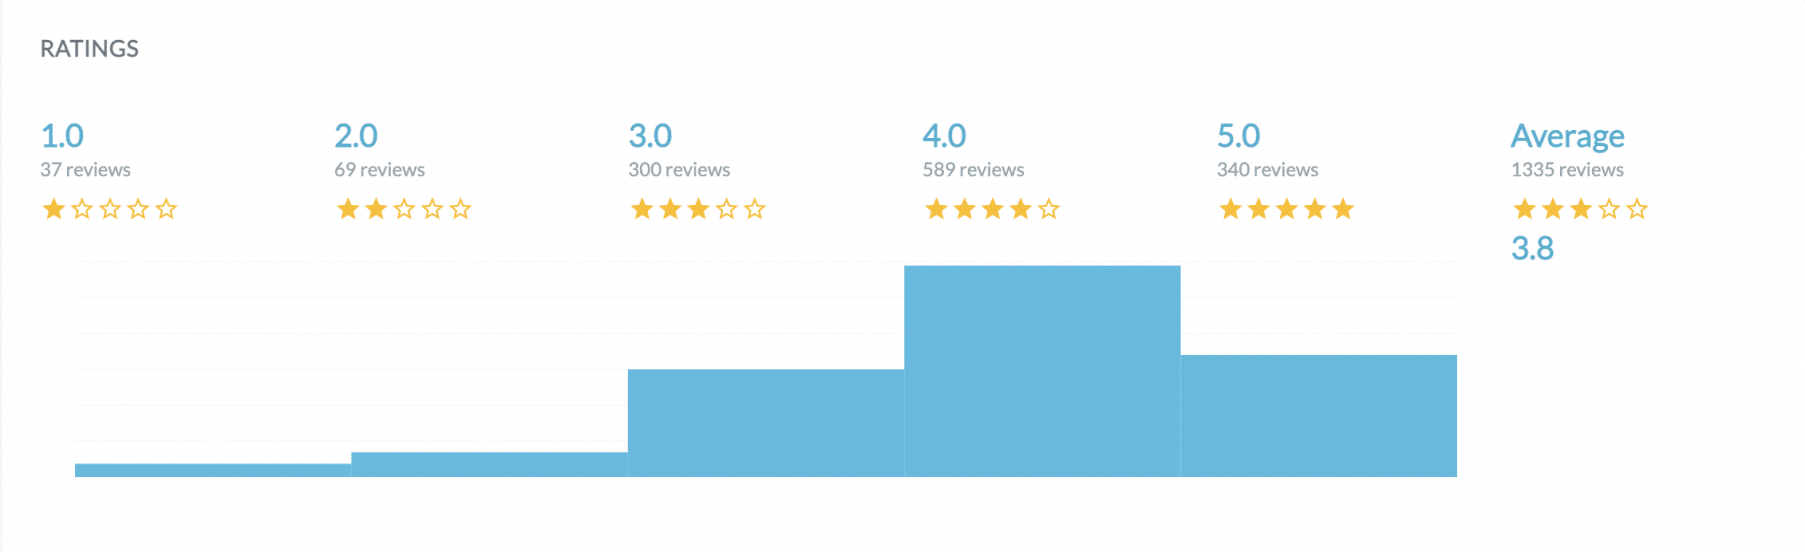
4. Ratings
This widget shows the distribution of star ratings across all platforms. Besides, you can see the average rating across all platforms.