
Internal Benchmarking
Benchmarking is a powerful management and strategy tool to compare the performance of different locations. It is tailored to the needs of a multi-location business.
For Internal Benchmarking, choose My Locations under Benchmarking on the left-side menu.
Statistics
In the Statistics, it is possible to see a list of all your locations that you have connected in re:spondelligent app.
This dashboard allows you to compare the performance of different locations, set goals, and refine strategy.
The KPIs include:
- re:Score
- Number of reviews
- Ave. rating
- Distribution of negative, positive, and neutral sentiments
- Response rate
- Response time

You can organize the list according to your needs. Click on the column headline to sort in ascending or descending order. For example, you can see the locations with the lowest re:Score by clicking once on the re:Score.
Use the date picker at the top of the dashboard to change the timeframe.
How to choose locations
By default, you see only one location that you have chosen in the list at the top of the page.

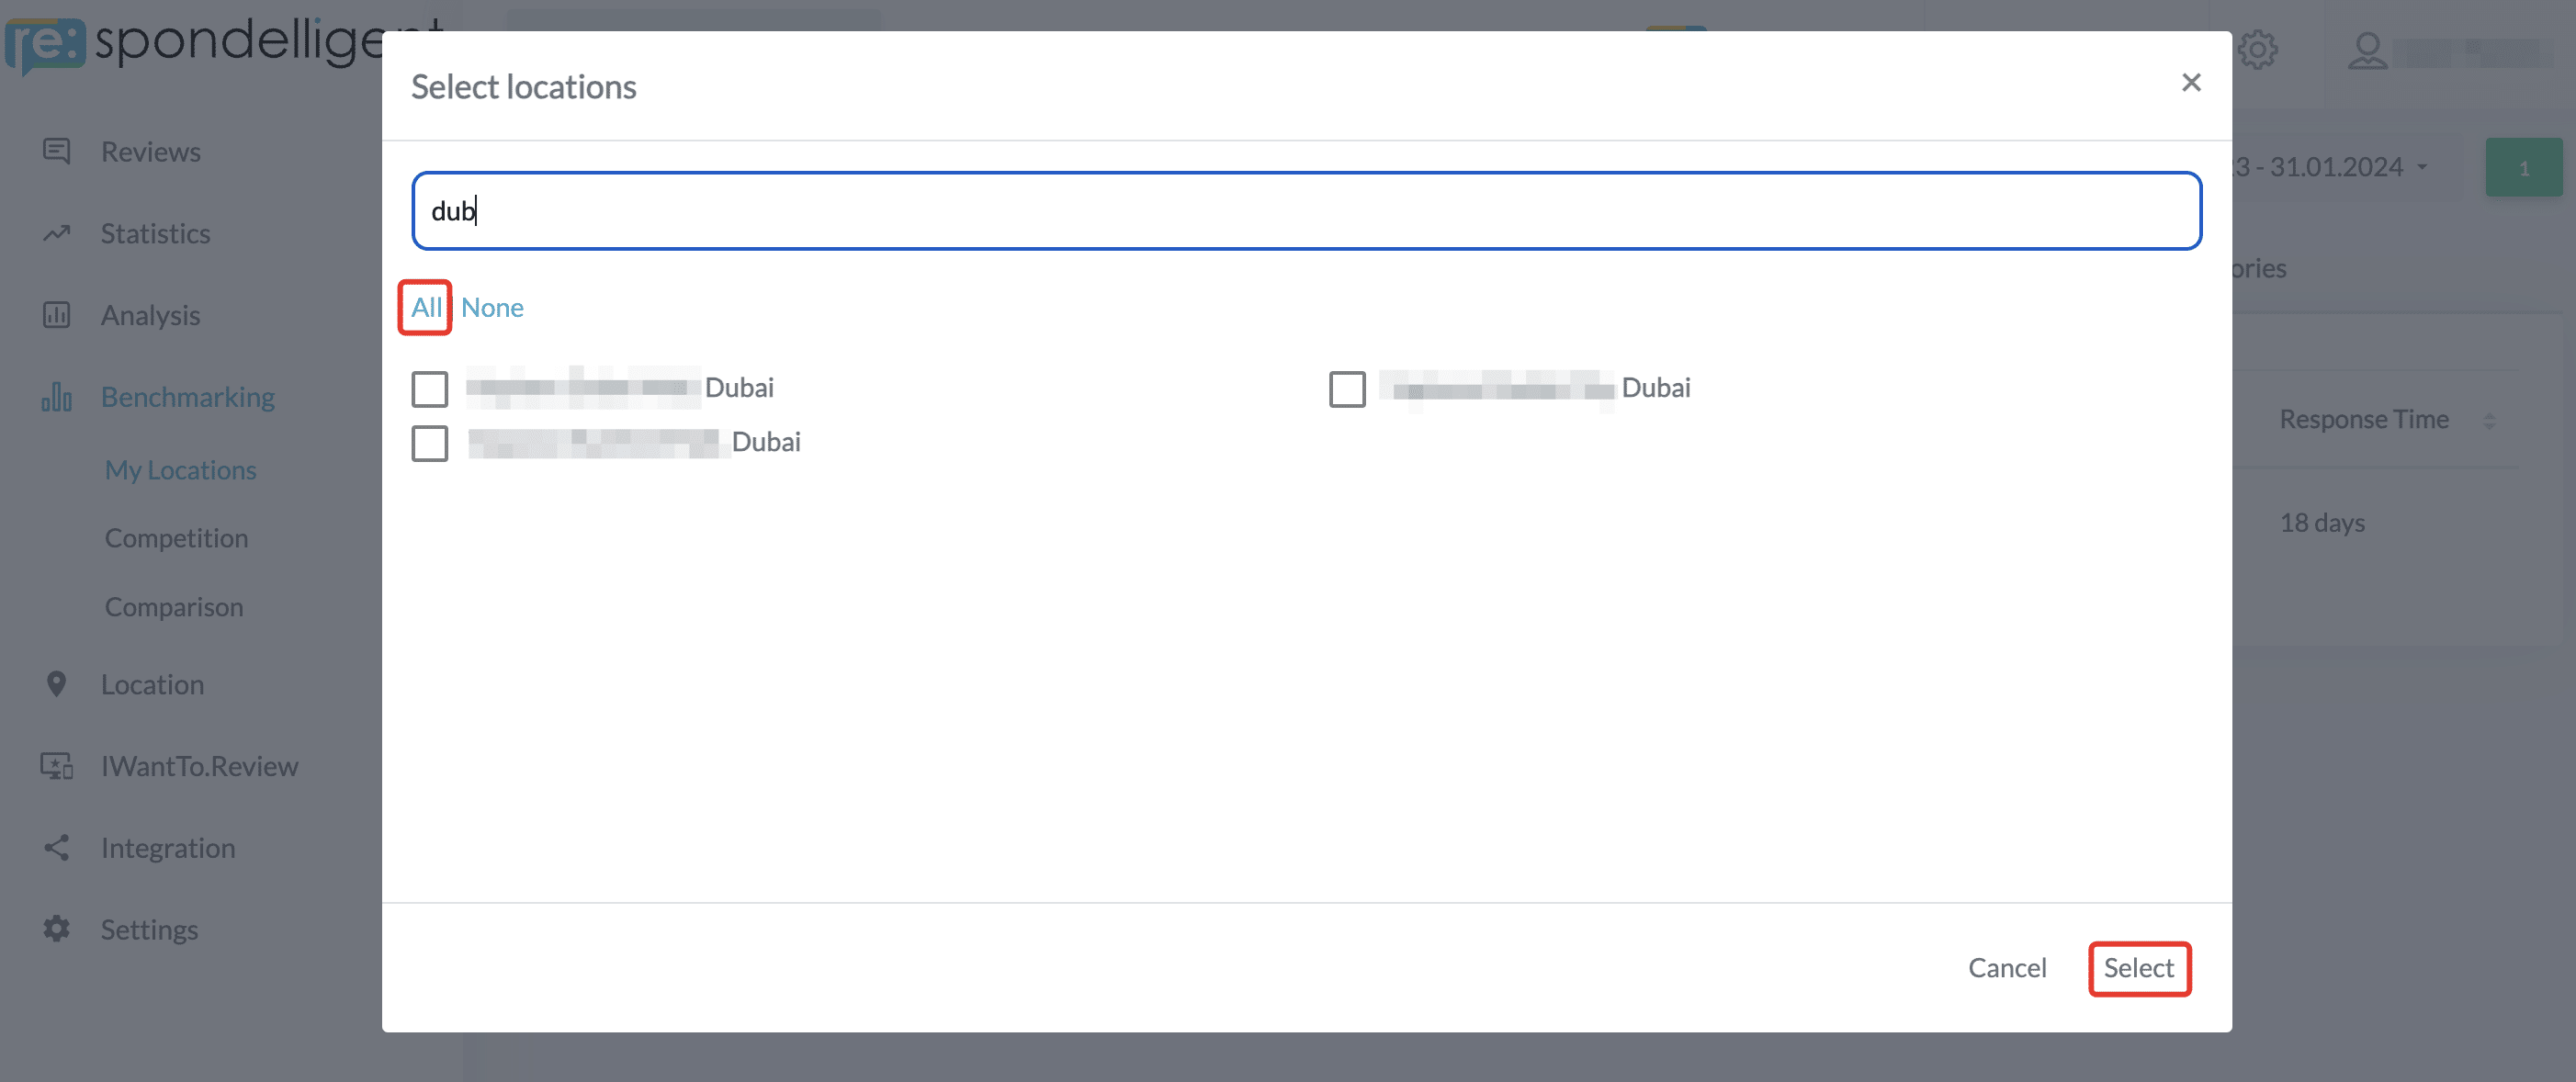
In order to add more locations to the list, click on the green button. A window will open where you can select more locations. You can click on All to select all the locations that you have access to. Furthermore, you can use the search bar to search for a specific name. Once you start typing you will see the list of those locations that contain the text you entered. Now click on All to choose only those locations that you see in the filtered list.
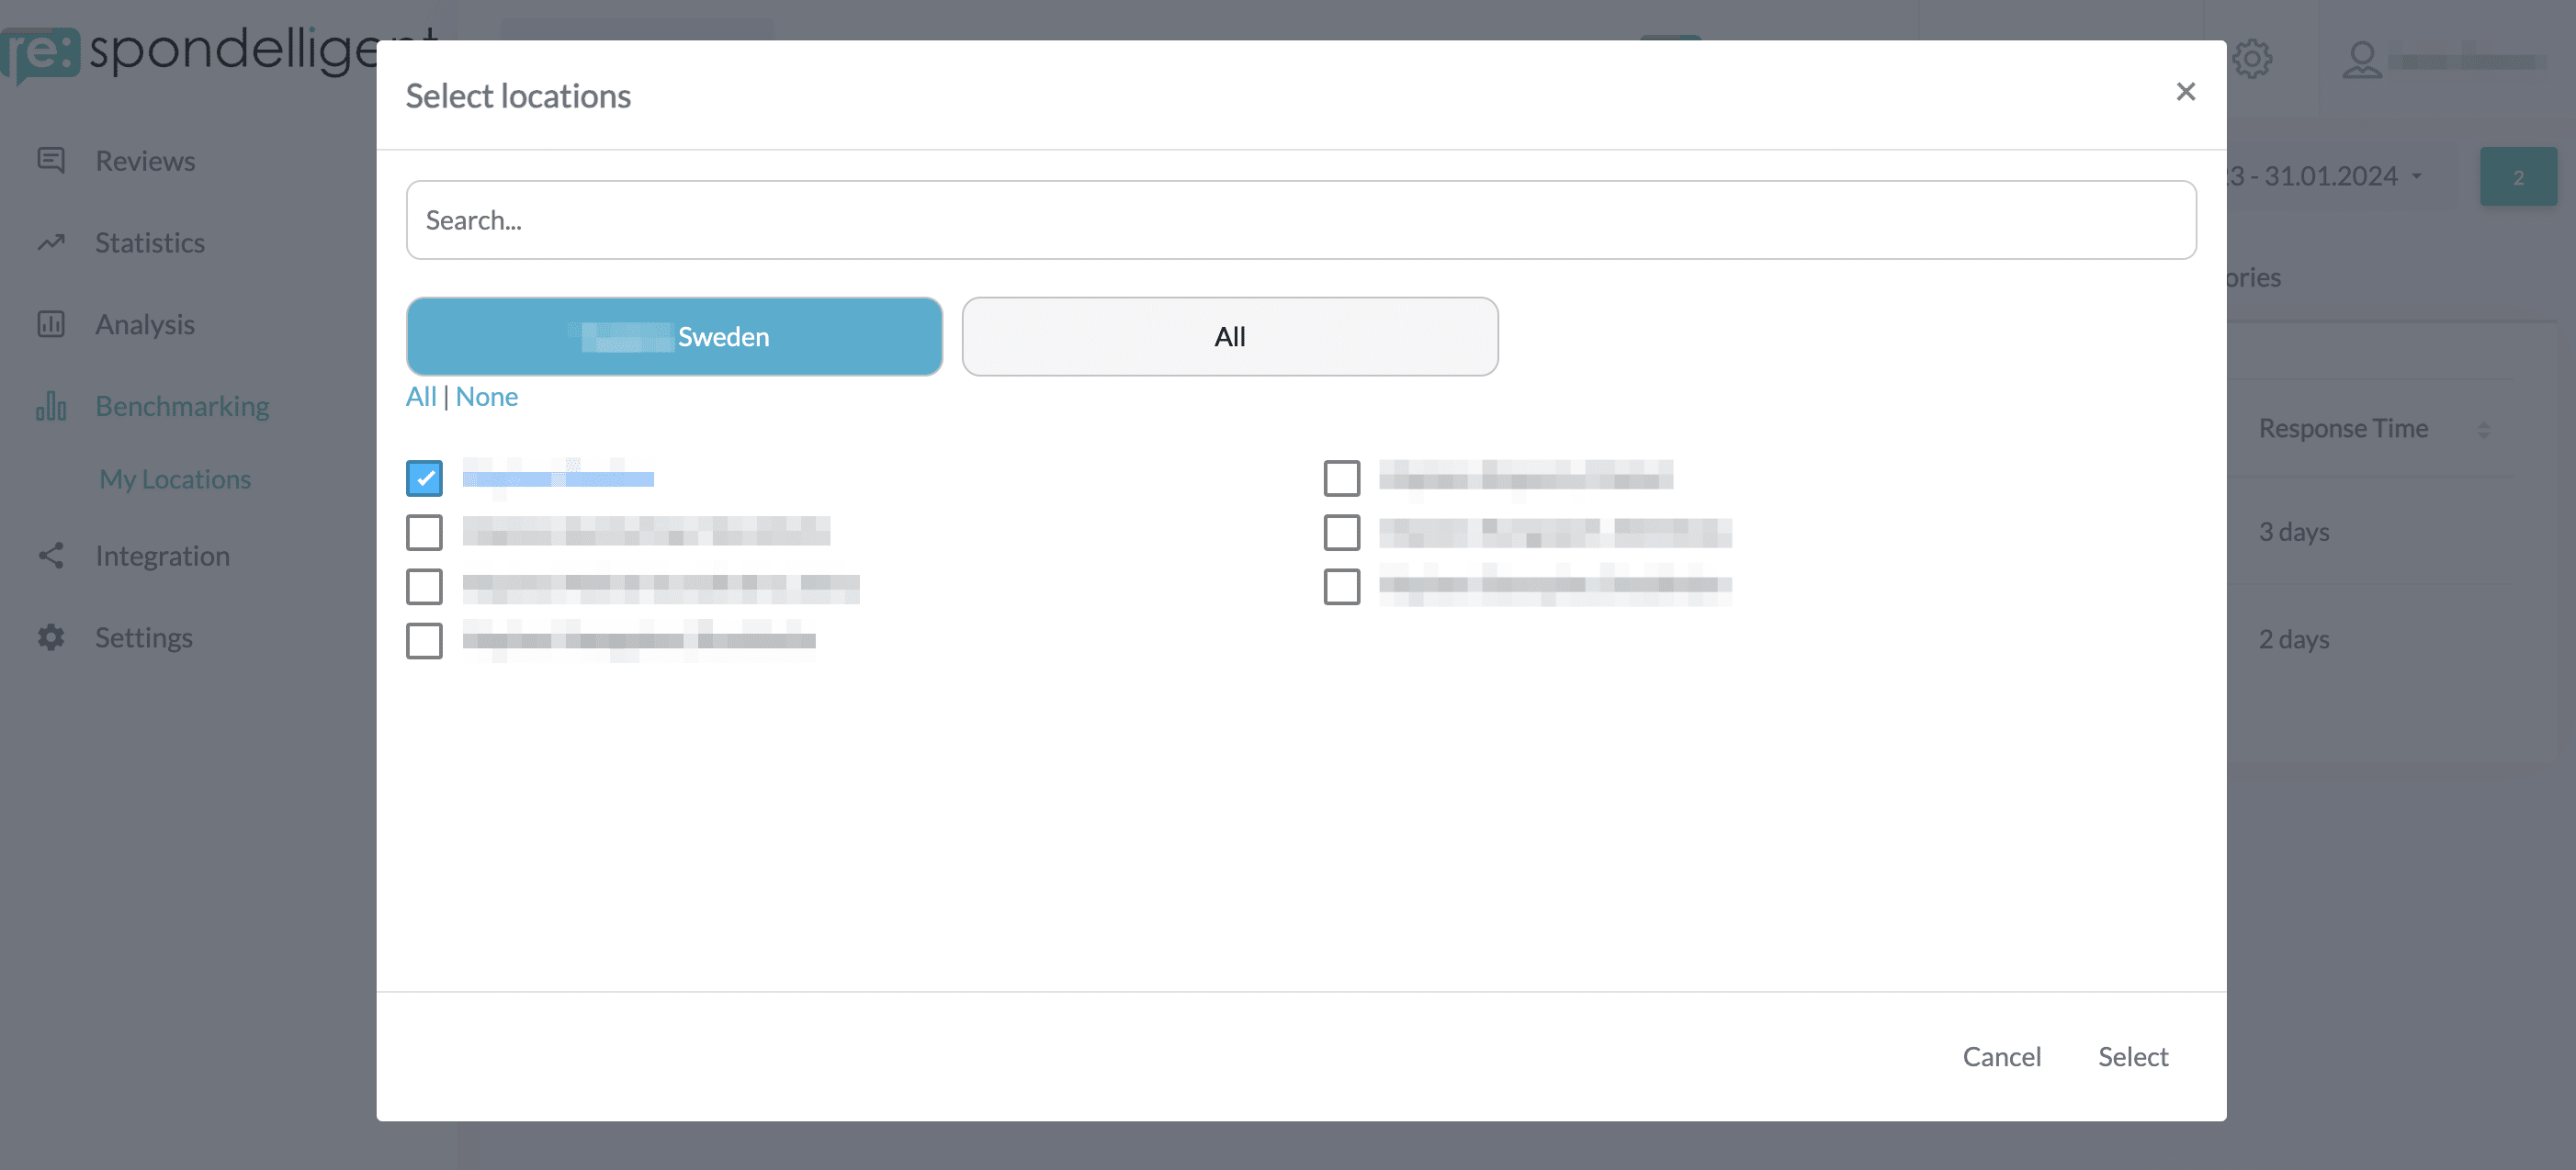
If you manage multiple locations that are organized in groups, choose a group in the list at the top of the page. Then in My Locations in the Overview section click on the green button. Now you can select all the locations that are part of the group you have chosen. Besides, you can add other locations or groups of locations if you click on the tab All.
Analysis
In Analysis, you can view the content analysis by category. You can adjust the timeframe using the date picker at the top. Click the green button to select the locations you want to compare.
To sort the list in ascending or descending order, click on the column headlines. For example, if you click on the Service headline, you will see the locations with the lowest performance in the Service category at the top.

The number on the left is the total number of mentions, and the number on the right is the average rating per category. If you click on these numbers, you will see the distribution of positive, neutral, and negative mentions on the right.
If you click on the numbers below the sentiments, you will see the reviews with highlighted mentions that are relevant to the category you have selected. Clicking on the blue location name will redirect you to the content analysis in a new tab.
re:Score Trend
re:Score development can be monitored in the Trend widget. Hover over the graph to see the exact scores for each month.

By clicking on the green button you can choose which locations you would like to see in the Trend widget. To export the data into an excel file, click on the blue button.
Categories
The Categories widget gives a quick overview of the content analysis of online reviews. The spider chart shows the development of average ratings in each category. The best thing is that you can easily compare different locations in one chart. First, select the locations you would like to compare to each other by clicking on the green button. Remember that only the locations of the same channel can be compared. For example, two restaurants, but not a restaurant and a hotel.
